Introduction
Remote
sensing for forestry applications - a historical retrospect
Tomas Brandtberg, Centre for Image Analysis, Swedish University of Agricultural Sciences
The
first aerial image ever was acquired in Paris in 1856 by F. Tournachon
(Flygbildsteknik och Fjärranalys, 1993). The image was taken from an
air-balloon and the altitude was rather low. In Sweden, S. A. Andrée introduced
aerial photography in 1893 and, once again, the platform was an air-balloon. In
the first decades of the 20th century, aeroplanes replaced the old inflexible
platform. During World War I (1915) the first fixed mounted camera in an
aeroplane was used for remote sensing purposes, mainly espionage. The fields of
photogrammetry and remote sensing were established as fast developing areas of
technology in Central Europe in 1920-1940, and they continued to develop during
the second half of the century. After a hundred years, the fields have
benefitted from, e.g., space technology, making use of modern satellite
navigation technology (such as Global Positioning Systems, GPS) and high
performance computers to
improve their capabilities in many respects.
During
the 20th century, the manual interpretation of medium and high spatial
resolution aerial imagery for forestry has evolved. As early as 1926, the first
ambitious Swedish trial to make a functioning map production based on aerial
photography was started. One reason for this early pioneering work was the need
in silviculture. The field of application has been a key force in the
development of new methods based on the aerial photography technology, see e.g.
Spurr (1948).
From
this well-established field of application, in practical use in the forestry
community all over the world, a new research branch was born: Automated interpretation of high spatial
resolution digital imagery for forestry. The main goal is to fully or
partly replace the human image interpreter by a seeing computer, capable of
making many decisions on its own, with a minimum of human intervention during
the image processing and analysis. A good review of the state-of-the-art of the
research from different countries is given in Hill and Leckie (1999). The
methods are at an early stage and might be somewhat immature, but new
initiatives are planned and the next decade will probably show a rapid growth
of more intelligent high-level image analysis systems. The degree of
specialization to forestry and its specific problems can be expected to
increase in future remote sensing systems (Leckie, 1990).
To
replace the human interpreter by a machine vision system is not an easy
endeavour. There is a tendency to under-estimate the capabilities of the human
visual system, especially because the knowledge about it is still rather
limited. Vision in this context can be thought of as a process that uses
images of the external world to produce a description that is useful to the
viewer and not cluttered by irrelevant information (Marr, 1982). A simple
example, based on a monocular image, where the computer has an obvious
potential advantage compared with the human visual system, is the Ebbinghaus illusion (e.g., Sonka et al.,
1998). It is shown in Fig. 1, where the two central objects (possibly tree
crowns) to the left and right, respectively, have the same physical dimensions
on the paper. The manual interpreter needs a measuring tool or must hide the
neighbours in order to correctly interpret the information content of the
image. On the other hand, the machine vision system must be programmed
efficiently.
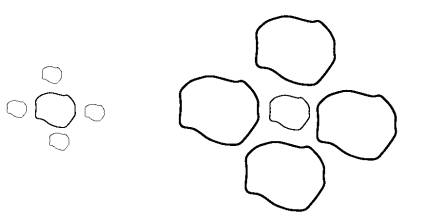
Fig.1
The Ebbinghaus illusion applied on image objects which resemble tree crowns.
The central objects to the left and to the right, respectively, have the same
physical dimensions.
Data acquisition and Analysis
Various
airborne sensors exist for data acquisition. In this text traditional aerial
photographs are briefly described.
Aerial photographs
During
the last fifty years the technical quality of the most common film types has
been developed and the trend nowadays is rather towards fine tuning of the film
characteristics. There are mainly four groups of film for aerial photography
(Flygbildsteknik och Fjärranalys, 1993): black-and-white panchromatic film,
colour film, black-and-white infrared film, and colour infrared film (CIR). The
CIR film type has the capability to capture reflectance characteristics of the
vegetation. Fig. 2 shows a CIR high spatial resolution aerial photograph from
central Sweden (flight height 600 m, f=300 mm). Some important features of the
film are described below.
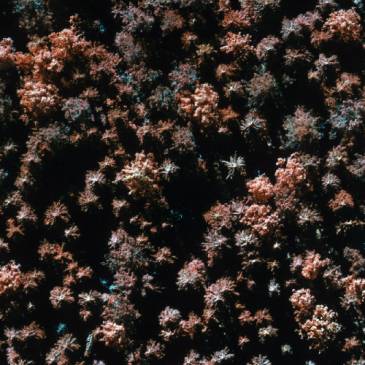
Fig.
2. A 50 x 50 meters colour infrared aerial photograph with visible overstory
individual
trees. Mixed forest (Scots pine, Norway spruce, and Birch).
The
spectral sensitivity of the CIR film (and a yellow filter) is in the wavelength
interval 500-900 nm (1 nm = 10-9 m), for all three layers in
combination. The film layers contain the three primary colours of pigments,
i.e., cyan, magenta, and yellow (CMY) (Gonzalez and Woods, 1992), respectively.
Each one subtracts a primary colour of light, i.e., red, green or blue (RGB).
The approximate individual sensitivities for the three film layers are: 500-900
nm, 500-700 nm, and 500-600 nm, respectively. An interesting feature of the
film is that the sensitivity in the second and third film layers is almost
three times as high as in the first film layer (sensitive to near-IR light).
This is a compensation for the fact that healthy vegetation reflects a lot of
light in the near-IR interval (700-900 nm), compared with the interval 500-700
nm.
The
characteristic curves of the film are not perfectly parallel, and their shape
depends on the specific film development. The curves are very steep which means
that the correct
exposure
is in a rather narrow interval, where one can use the parallel part as a
mapping to the vertical y-axis. The intention is to have a high dynamic range
along the y-axis. The imperfectly parallel curves will cause a change in colour
balance (the densities in relation to the three layers), if the exposure is
shifted a little along the x-axis. At the top and bottom of the graphs, where
the film is not correctly exposed, a lot of scene information will be lost and
the remainder will be mixed up with noise. That kind of information lost can never
be recovered. At the extreme positions of the curve, to the left and to the
right along the x-axis, the film is completely black or white, respectively,
and no meaningful image analysis can be performed.
An
important concept in this text is the image.
An image can be created in many ways, but in this context there is a specific
mapping of the world (a forest scene) that is the origin of the image data.
During the mapping each image point is assigned a value (e.g., in a digital
image an integer). The captured image data can be described with a function
(Ross and Wright, 1992), as shown in Fig. 3. It is a fundamental concept for
the image analysis techniques.
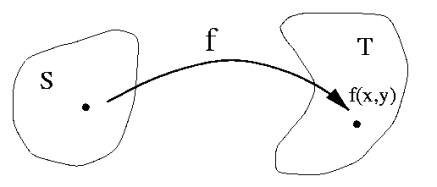
Fig.
3. A function f mapping S into T
describing the image data of an aerial photograph,
where
S is the (x,y)-plane, and the image
of (x,y) under f is a subset of T.
The
near-nadir case is the simplest one, and a natural research process emerges
from this point. There is a natural contradiction between the use of near-nadir
monocular high spatial resolution aerial images, and the covering of large
forested area. This problem can be handled by using the aerial photography
system as a sampling tool (e.g., Befort, 1988; Spencer and Hall, 1988; Schlyter
and Anderson, 1997).
A
general comment is needed here concerning the pixel size of a digitized aerial
photograph. The Shannon sampling theorem
(see, e.g., Sonka et al., 1998) needs to be considered. The theorem has a
simple physical interpretation in image analysis: The sampling interval should
be chosen in size, such that it is less than half of the smallest interesting
detail in the image. This is important to know, so that no important
information is lost during the scanning of the photographs. In a digital
camera, the Shannon theorem will be an internal phenomenon during the flight,
in combination with the ability of the lens to resolve objects on the ground.
High altitude will decrease the resolution.
Previous examples of individual tree-based image
analysis
In
high spatial resolution imagery of forest it is no longer applicable to work
with pixels as the basic units. The natural approach is to detect visible
single trees as light image objects and use them as individuals in the
subsequent analysis (Pinz et al., 1993). The estimated tree crown dimensions
are appropriate to use to predict the stem dimensions (Minor, 1951; Jakobsons,
1970). Further measures of the image
objects might be used as a complement.
To
detect the region of a single tree crown, one of the most fundamental concepts
of a visual processing system must be introduced: segmentation (Marr, 1978). The purpose in this context is to divide
the aerial image into regions of interest in the (x,y)-plane, i.e., visible
individual tree crowns, that are used as meaningful units in the subsequent
process. The goal of segmentation is in this context rather well formulated,
but one can question whether the image objects should be emphasized, or the trees
in the forest on the ground. A general comment is that the vision system works
with the image, and not with the scene on the ground. This fundamental
difference constitutes a limit of the performance, depending on the complexity
of the forest. One approach of the analysis is to introduce specialized
knowledge about the objects during segmentation (Marr, 1978). This has been
done in, e.g., the template matching case (Pollock, 1996; Larsen and Rudemo,
1997), and to some extent in Gougeon, 1995b.
In
early vision there seemed to be a clear need for being able to perform early
visual
processing
roughly and fast, as well as more slowly and accurately (Marr, 1978).
The
group of fast and rough methods contains techniques of characterizing their approximate extent and shape, and the
group of slow and accurate methods contains techniques of characterizing
their precise boundaries. Fig. 3 shows many single tree crowns whose
rough boundaries are clear, but whose exact boundaries are not
clear.
In Brandtberg and Walter ( 1998), the
proposed approach has been adopted, and indirectly in Pinz et al. (1993): first
detection of local intensity maxima, followed by region analysis.
To
briefly understand how light image objects can be found in a digital image,
a
short introduction of differential geometry on two-dimensional images is
needed.
Images
(such as aerial photographs) and the geographical landscape are approximate
examples of scalar functions defined upon the (x,y)-plane with its Euclidean
metric (Koenderink and van Doorn, 1994). The relief is characterized by
critical points (e.g., minima and maxima) and certain singular curves, the
so-called ridges and courses (Eberly et al., 1993). All these are true image
features, and they can be used to detect or delineate individual tree crowns in
a digital image. One can observe that in a slightly smoothed aerial image of a
forest, a zero-crossing (i.e., the
position along the gradient direction where the second derivative changes sign)
with large gradient magnitude is, typically, a delimiter between the object and
the background. On the other hand, a valley
is, typically, a (dark) delimiter between two different (light) image objects,
or blobs, in the image.
An
aerial image of a forest depicts trees in different positions relative to each
other.
Three
typical cases can be recognized as showed in Fig. 4, where different image
features can be used by the visual system. Case A is the simplest one and it
might be sufficient to optimally threshold the image (Chi et al., 1996), i.e.,
finding all pixels in a suitably defined value interval. In cases A and B,
respectively, the local maximum might be useful to detect the light tree top.
In case B, an appropriate valley detector (Eberly et al., 1993) might be able
to find the delimiter, and in case C, a compact object without grey-level
valleys, the detection of the individual trees must be based on the visible
edges or contours, i.e., directly or indirectly.
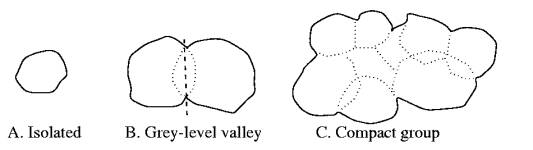
Fig.
4. Three typical cases of segmentation of individual tree crowns in high
spatial resolution images: isolated tree crown (A), slightly touching tree
crowns with a dark valley in between (B), and a compact group without any
valleys (C). Dashed lines indicate the true physical tree crown contour.
Single tree isolation techniques
This
section describes the three fundamental different methods that exist to locate
or delineate individual tree crowns in high spatial resolution aerial images.
Generally, they can be divided into three principles, depending on the
extracted and used image information: detection of local intensity maximum,
contour-based methods, and template-based matching. They are not directly
comparable, because they extract different information. This section presents
some examples of each method, together with important details.
The
first technique, and the simplest one, identifies the local intensity maxima
where
all
the neighbouring pixels contain a lower value. Typically, this pixel is at the
peak of
the
tree crown reflectance, which is located at or very close to the true tree top.
Often,
the
reflectance peak is shifted a little towards the sun in the northern boreal
forests.
In
a very dense clump of trees there might be no direct local intensity maximum or
just one for the whole group.One of the early experiments of an automatic tree
counting system, was based on digital aerial colour infrared films and on the
detection of local maxima and is reported in Blazquez (1989). The flight height
was 610 m (focal length: 150 mm). The interpretation involved registration of
an individual tree in relation to other trees in a citrus grove. The
localisation of individual trees was thus based on local image intensity peaks
of the tree crown, where several peaks per tree were sequentially numbered. In
this early work, it was concluded, e.g., that large trees planted in hedges
could not be counted very well, which was due to the previously explained
problem, that the correspondence between the local intensity maxima and the
individual trees on the ground was not complete. They revealed other problems
as well, e.g., such as undesirable background phenomena, and technical
photographic problems, such as the inability to consistently reproduce the same
colour balance. The work established an early proof-of-concept, that it might
be possible to produce an automated tree counting system. In Blazquez (1990), a
further study is focused on the effect of sun angle and the effect of shadows
on interpretation of tree health and size.
Detection
of local maxima can be combined with (optimal) image smoothing. A study on stem
number estimation by Gaussian kernel smoothing of panchromatic aerial
photographs (scale of 1:4000 and approximately a pixel size of 15 cm) in
Denmark, is described in Dralle and Rudemo (1996). The test forest was a
thinning experiment in pure even-aged Norway spruce. For the important Gaussian
kernel bandwidth estimation problem, it was suggested to use the position of
the crossing of two curves: the internal
and the external curve. The internal
curve for a stand or sub-plot, describes the number of local maxima above a
certain level of the smoothed image, at a series of bandwidths. The external
curve is based on a series of stands with different and known stem numbers,
using a nonlinear regression method. The method is reported to perform
satisfactorily for all thinning grades, except for the unthinned one. This
conclusion is similar to the analysis of the dense citrus hedge, above.
In Uuttera et al. (1998),
a Finnish study examined the possibilities of using computer-based
interpretation of aerial photographs (scale of 1:5000) in determining the
spatial
distribution
of trees, based on detection of local intensity maxima. The process to detect
individual
trees involved image normalisation, the Gaussian-Laplacian operator, and
finally, differentiation determined the radii of the tree crowns and their
locations.
The
location of a tree was estimated using the local maxima above a certain
grey-level
of
the smoothed infrared band, which is similar to the Danish method above, and
the window size of the operator. The crown coverage was determined by region
growing segmentation combined with active surface representation. A major
conclusion of the paper is that because the process misclassified clustered
spatial patterns as regular patterns, and regular patterns as random patterns,
the usability of digital aerial photographs seems to be limited for the
point-process based determination of the spatial pattern of trees if the scale
is 1:5000 or less. It was proposed that the estimation of the crown coverage,
on the other hand, might be applied in practical forestry.
The
detection of local maximum points can be combined with an advanced region-based analysis of the image
objects. Such a system has been developed in Austria (Pinz, 1989; Pinz et al.,
1993). It was developed on digital high spatial resolution colour infrared
aerial images, with a pixel sizeof 40 cm, approximately. The system starts with
a search for bright blobs in the image, by applying a series of different low-pass
filters. It is followed by local maxima detection, where each detected maximum
is a candidate for the centre of the tree crown. Subsequently, radial
brightness distributions are used to determine whether the shape of the object
is similar to a tree. If the test holds, an estimate of the tree crown radius
is available, otherwise the maximum is disregarded. Finally, further analysis,
e.g., a fusion process, removes double points in a single tree crown.
The
next level of feature extraction to utilize for delineation of single tree
crowns, is
contour-based.
One should be careful when the word contour is discussed. In this text, the
contour is defined as a delimiter in the image, between an object (tree crown)
and the background, and a valley is a
delimiter between two different image objects. The first example of this
technique was developed in Canada (Gougeon, 1995b), and the specific method is
called a crown-following approach. It
is thus a contour-based segmentation method and it is also
called a valley-following method
(Pinz et al., 1993). It was originally used on high spatial resolution (pixel
size 31 cm) aerial multispectral images from the MEIS-II sensor. The presented
approach consists of first isolating crowns from the background, and from other
tree crowns. Secondly, a valley-following process finds the shaded parts
between the tree crowns. Further analysis ensures that the tree crowns are more
precisely separated, using a rule-based program. The reported results are
within 7.7 % of the ground counts, compared with 18.1 % using
photo-interpretation as truth. In general, 81 % of the crowns are the same as
those obtained by the visual interpretation of the MEIS-II imagery. In Gougeon
(1999), more details and future development directions are given.
The
third and last technique, to find the tree crowns, or image objects, is template matching. It is definitely the
most computationally demanding if the original idea with many different
templates is utilized. It may be noted that the method finds the tree crown,
its extent, and the tree species at the same time, once the right template has
been found.
The
first vision system capable of recognizing individual tree crowns, based on
matching of a synthetic tree crown image model with an aerial image, was
developed in British Columbia, Canada, in the beginning of the 90's (Pollock,
1996). The system has been tested on monocular high spatial resolution image
data acquired with the MEIS-II (pixel size 36 cm) and CASI sensors (pixel size
60 cm) for scenes in Ontario and Alberta (Pollock, 1999). The procedure is
based on a model of the image formation process at the scale of an individual
tree. Natural variation of the tree crown is considered, as is the species.
The
tree-image variation that is a function of image geometry is also taken into
account.
The
system uses user-generated training data and exploits a constraint on the
spatial
relationship
between tree neighbours in the forest. Important objectives during the outline
of the system were: (1) not to be limited to stands with uncrowded trees, and
(2) the full extent of the image could be used, and not only a near-nadir view
of the scene.
Other
works based on the optical tree model found in Pollock (1996) are Larsen and
Rudemo (1997), Larsen and Rudemo (1998) and Larsen (1999), where digitized
panchromatic photographs were used (altitude 560 m, pixel size 15 cm) on Norway
spruce.
Tree species classification
The
image objects that were identified as regions-of-interest (ROI) in the previous
ection, must usually be classified into different species groups. The only tree
identification technique that has a built-in sub-system for that step is the
template matching method. It makes use of the a priori knowledge about the 3D shapes of the species groups during
template modelling.
One
can discern some basic features of the image objects that are connected with a
specific species group: spectral characteristics, internal structure of the
tree crown, the general distribution of the reflectance intensities of the tree
crown, the shape of the visible contour (straight from above or from an
inclined angle), and to some extent
the
context in the forest.
The
great variation of the natural objects makes the classification problematic. In
exceptional cases one can find individuals of a species group that look
perfectly like the average individual of another species group. To solve some
of the classification problems and to find a decision function, a few different
techniques have been utilized.
The
most interesting and frequently used feature in species classification is the
spectral characteristics of the tree crown. A comparison of possible
multispectral classification schemes for tree crowns is given in Gougeon
(1995a). Five out of seven schemes led to relatively equal accuracies (72 ± 3
%), and the results could be slightly improved (76 %) by using canonical
analysis (CA) prior to classification.
The
application of neuromorphic methods (Pinz et al., 1993) for individual tree
species classification is in contrast
to the traditional statistical approaches. An advantage is that it is not
necessary to explicitly formulate the tree crown features extracted from the
image. In the cited study, by using a method termed neural network surgery, the prediction accuracy for the training
set was reported to be 93 %, and for the test set it was 90 %. The image data
consisted of colour infrared aerial photographs of five tree species in Central
Europe.
Estimation of other individual tree-based
parameters
Other
individual tree-based parameters can be extracted from the aerial images, to
measure or predict ground-based parameters. An early conclusion about the
colour
infrared
images (CIR) was that unhealthy and stressed (citrus) trees might be detected
and assessed (Blazquez, 1989). This has been recently utilized in Sweden
(Schlyter and Anderson, 1997), with manual interpretation of the CIR aerial
images, to predict tree health in the southern part of the country. A study on
the effect of needle loss on coniferous forest reflectance, based on a model
prediction, is given in Nilson (1991). Unfortunately, the simulation revealed
difficulties to establish a general relationship.
In
Dralle and Rudemo (1997), the position of the tree at ground level was
estimated using a displacement model incorporating the sun angle, camera
position, and tree height. Gaussian smoothed panchromatic aerial images in
Denmark (Norway spruce plantation) were utilized. The root mean square residual
error in the displacement model was reported to be as good as 65 cm. The
problem can also be solved with template matching (Larsen and Rudemo, 1997;
Larsen, 1999).
References
Anon., 1993. Flygbildsteknik och Fjärranalys. Nämnden för
Skoglig Fjärranalys, Skogsstyrelsen, SE-551 83 Jönköping. (In Swedish.)
Befort,
W. 1988. Controlled-scale aerial sampling photography: development and
implications for multiresource inventory. Journal of Forestry, November, pp.
21-28.
Blazquez,
C.H. 1989.Computer-Based Image Analysis and Tree Counting with Aerial Color
Infrared Photography. Journal of Imaging Technology 15(4): 163-168.
Blazquez,
C.H. 1990. Large Scale Aerial Photography of Citrus Trees with Color and Color
Infrared Film. Journal of Imaging Technology 16(3): 101-104.
Brandtberg, T., and Walter, F. 1998. Automated
delineation of individual tree crowns in high spatial resolution aerial images
by multiple-scale analysis. Machine Vision and Applications 11: 64-73.
Chi,
Z., Yan, H., and Pham, T. 1996. Fuzzy algorithms: with application to image
processing and pattern recognition. World Scientific Publishing Co. Pte. Ltd.,
Singapore.
Dralle,
K. 1997. Locating Trees by Digital Image Processing of Aerial Photos.
Dissertation.
Dina Research Rapport No. 58, Royal Veterinary and Agricultural University,
Denmark.
Dralle,
K., and Rudemo, M. 1996. Stem number estimation by kernel smoothing of aerial
photos. Can. J. For. Res. 26: 1228-1236.
Dralle,
K., and Rudemo, M. 1997. Automatic estimation of individual tree positions from
aerial photos. Can. J. For. Res. 27: 1728-1736.
Eberly, D., Gardner, R., Morse, B., Pizer, S., and
Scharlach, C. 1993. Ridges for Image Analysis. Univ. of North
Carolina, Dep. of Comp. Science, Chapel Hill, Tech. Report TR93-055, USA.
Gonzalez,
R.C., and Woods, R.E. 1992. Digital image processing. Addison-Wesley Publishing
Company, Reading, Massachusetts, USA.
Gougeon,
F.A. 1995a. Comparison of possible classification schemes for tree crowns
individually delineated on high spatial resolution MEIS images. Can. J. Rem.
Sens. 21(1): 1-9.
Gougeon,
F.A. 1995b. A crown following approach to the automatic delineation of
individual tree crowns in high spatial resolution aerial images. Can. J. Rem.
Sens. 21(3): 274-284.
Gougeon,
F.A. 1999. Automatic individual tree crown delineation using a valley-following
algorithm and a rule-based system. In: Proceedings of Automated Interpretation
of High Spatial Resolution Digital Imagery for Forestry, Victoria, British
Columbia, Canada, February 10-12, 1998. (Hill, D.A., and Leckie D.G., eds.)
Natural Resources Canada, Canadian Forest Service, Pacific Forestry Centre,
Victoria, British Columbia. pp. 11-23.
Hill,
D.A., and Leckie, D.G. (eds.) 1999. Automated interpretation of high spatial
resolution digital imagery for forestry. Proceedings of International Forum,
Feb. 10-12, 1998. Pacific Forestry Centre, Victoria, British Columbia, Canada.
Jakobsons,
A. 1970. Sambandet mellan trädkronans diameter och andra trädfaktorer,
främst
brösthöjdsdiametern. Rapport 14, Inst. f. skogstaxering, Skogshögskolan,
Stockholm. (In Swedish with English summary.)
Koenderink,
J.J. and van Doorn, A.J. 1994. Two-plus-one-dimensional differential geometry.
Pattern Recognition Letters 15: 439-443.
Larsen,
M., and Rudemo, M. 1997. Using ray-traced templates to find individual trees in
aerial photos. In: Proceedings of the 10th Scandinavian Conference on Image
Analysis, Vol. 2, Lappeenranta, Finland, June 9-11, pp. 1007-1014.
Larsen,
M., and Rudemo, M. 1998. Optimizing templates for finding trees in aerial
photographs. Pattern Recognition Letters 19: 1153-1162.
Larsen,
M. 1999. Jittered match windows voting for tree top positions in aerial
photographs. In: Proceedings of the 11th Scandinavian Conference on Image
Analysis, Vol. 2, Kangerlussuaq, Greenland, June 7-11, pp. 889-894.
Leckie, D.G. 1990. Advances
in remote sensing technologies for forest surveys and management. Can. J. For.
Res. 20: 464-483.
Manton,
K.G., Woodbury, M.A., and Tolley, H.D. 1994. Statistical Applications Using
Fuzzy Sets, John Wiley \& Sons Inc., New York, USA.
Marr,
D. 1978. Representing visual information. In: Computer Vision Systems, Hanson,
A., and Riseman, E. (eds.), Academic Press, New York, USA, pp. 61-80.
Marr,
D. 1982. Vision. Freeman, San Francisco, USA.
Minor,
C.O. 1951. Stem-crown diameter relations in southern pine. J. For. 49(7):
490-493.
Nilson,
T. 1991. Effect of needle loss on coniferous forest reflectance: a model
prediction. In: Proceedings of IGARSS'91 Symposium, Remote Sensing: Global
Monitoring for Earth Management, Helsinki University of Technology, Espoo,
Finland, June 3-6, 1991, pp. 1543-1546. IEEE.
Pinz, A. 1989. Final results
of the vision expert system VES: Finding trees in aerial photographs. In: Pinz, A. (ed.): Wissensbasierte Mustererkennung
(Knowledge-based pattern recognition), OCG-Schriftenreihe 49, Oldenbourg
Verlag, pp. 90-111.
Pinz,
A., Zaremba, M.B., Bischof, H., Gougeon, F.A., and Locas, M. 1993. Neuromorphic
methods for recognition of compact image objects. Machine Graphics and Vision
2: 209-229.
Pollock,
R. 1996. The Automatic Recognition of Individual Trees in Aerial Images of
Forests Based on a Synthetic Tree Crown Image Model. Dissertation. Department
of Computer Science, University of British Columbia, Vancouver, Canada.
Pollock,
R. 1999. Individual tree recognition based on a synthetic tree crown model.
\newblock
In: Proceedings of Automated Interpretation of High Spatial Resolution Digital
Imagery for Forestry, Victoria, British Columbia, Canada, February 10-12, 1998.
(eds. Hill, D.A., and Leckie, D.G.) Natural Resources Canada, Canadian Forest Service,
Pacific
Forestry Centre, Victoria, British Columbia. pp. 25-34.
Ross,
K.A., and Wright, C.R.B. 1992. Discrete Mathematics. Prentice Hall, Englewood
Cliffs, New Jersey, USA.
Russ,
J.C. 1995.The Image Processing Handbook. (2nd ed.), CRC Press Inc., Boca Raton,
USA.
Schlyter,
P., and Anderson, S. 1997. IR-95 --
Flygbildsbaserad inventering av skogsskador i sydvästra Sverige 1995. Rapport
3, Skogsstyrelsens förlag, SE-551 83 Jönköping, Sweden. (In
Swedish with English summary.)
Spencer,
R.D., and Hall, R.J. 1988. Canadian large-scale aerial photographic systems
(LSP). Photogramm. Engineer. Rem. Sens. 54: 475-482.
Sonka,
M., Hlavac, V., and Boyle, R. 1998. Image Processing, Analysis, and Machine
Vision. Brooks/Cole Publishing Company, Pacific Grove, CA, USA.
Spurr, S.H. 1948. Aerial
Photographs in Forestry. Ronald Press, New York. 340 pp.
Uuttera, J., Haara, A., Tokola, T., and Maltamo, M. 1998.
Determination of the spatial distribution of
trees from digital aerial photographs. Forest Ecology and Management 110:
275-282.
Åge,
P.J. 1985. Forest inventory - Photo interpretation.
The National Land Survey of Sweden, Gävle, Sweden, Report 13. (In English.)